CREATED BY: @AndLukyane
DESCRIPTION:
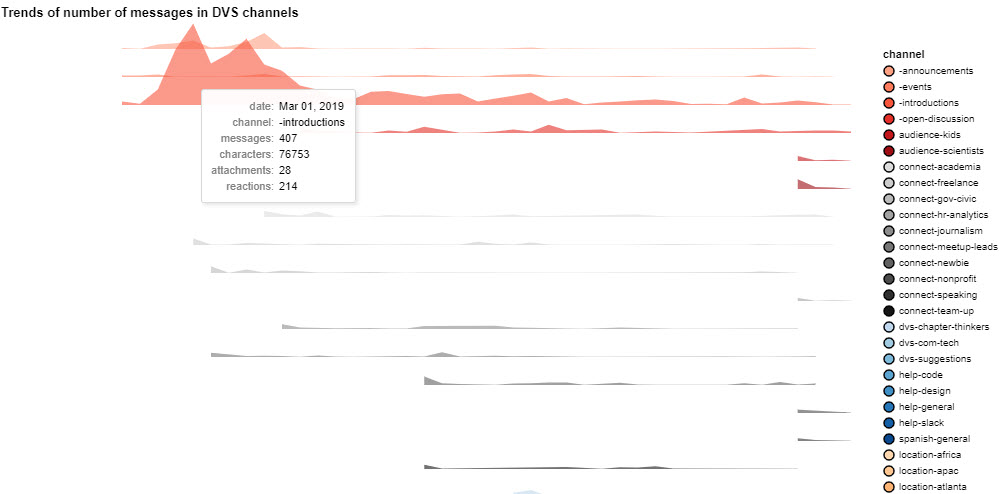
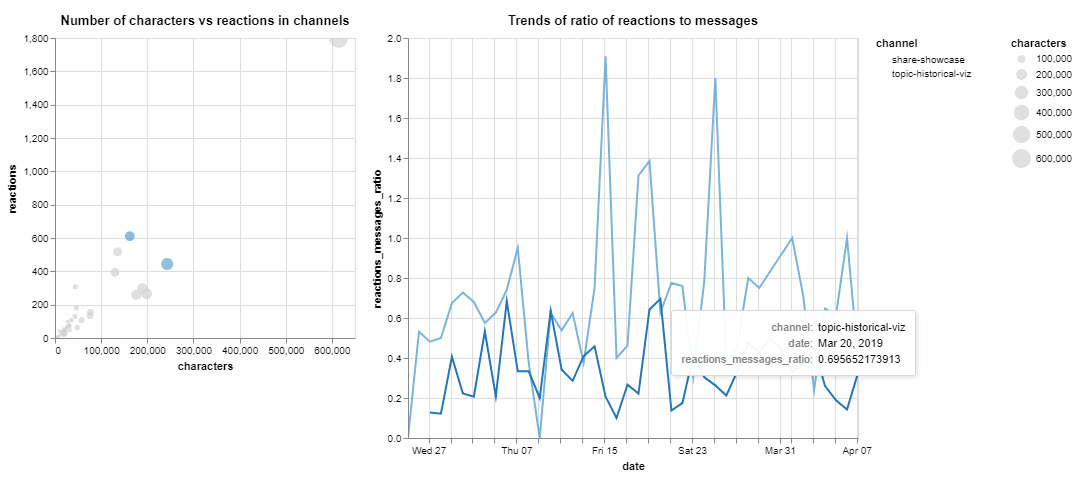
The first plot shows trends of number of messages by channels using ridgeline plot. In the second plot I have decided to explore engagement. In the left part you can see a scatterplot showing the number of reactions and messages length of varios channels. Clicking a circle with a channel (multiple selection with "shift" is possible) will show trends of reaction to message ratio on the plot to the right. In the last plot I want to explore most active channels by diccussions. On the left plot you can see channels sorted my mean message length. Clicking a channel bar will show trends of number of messages in the plot on the left.


