CREATED BY: David Rio Deiros
DESCRIPTION:
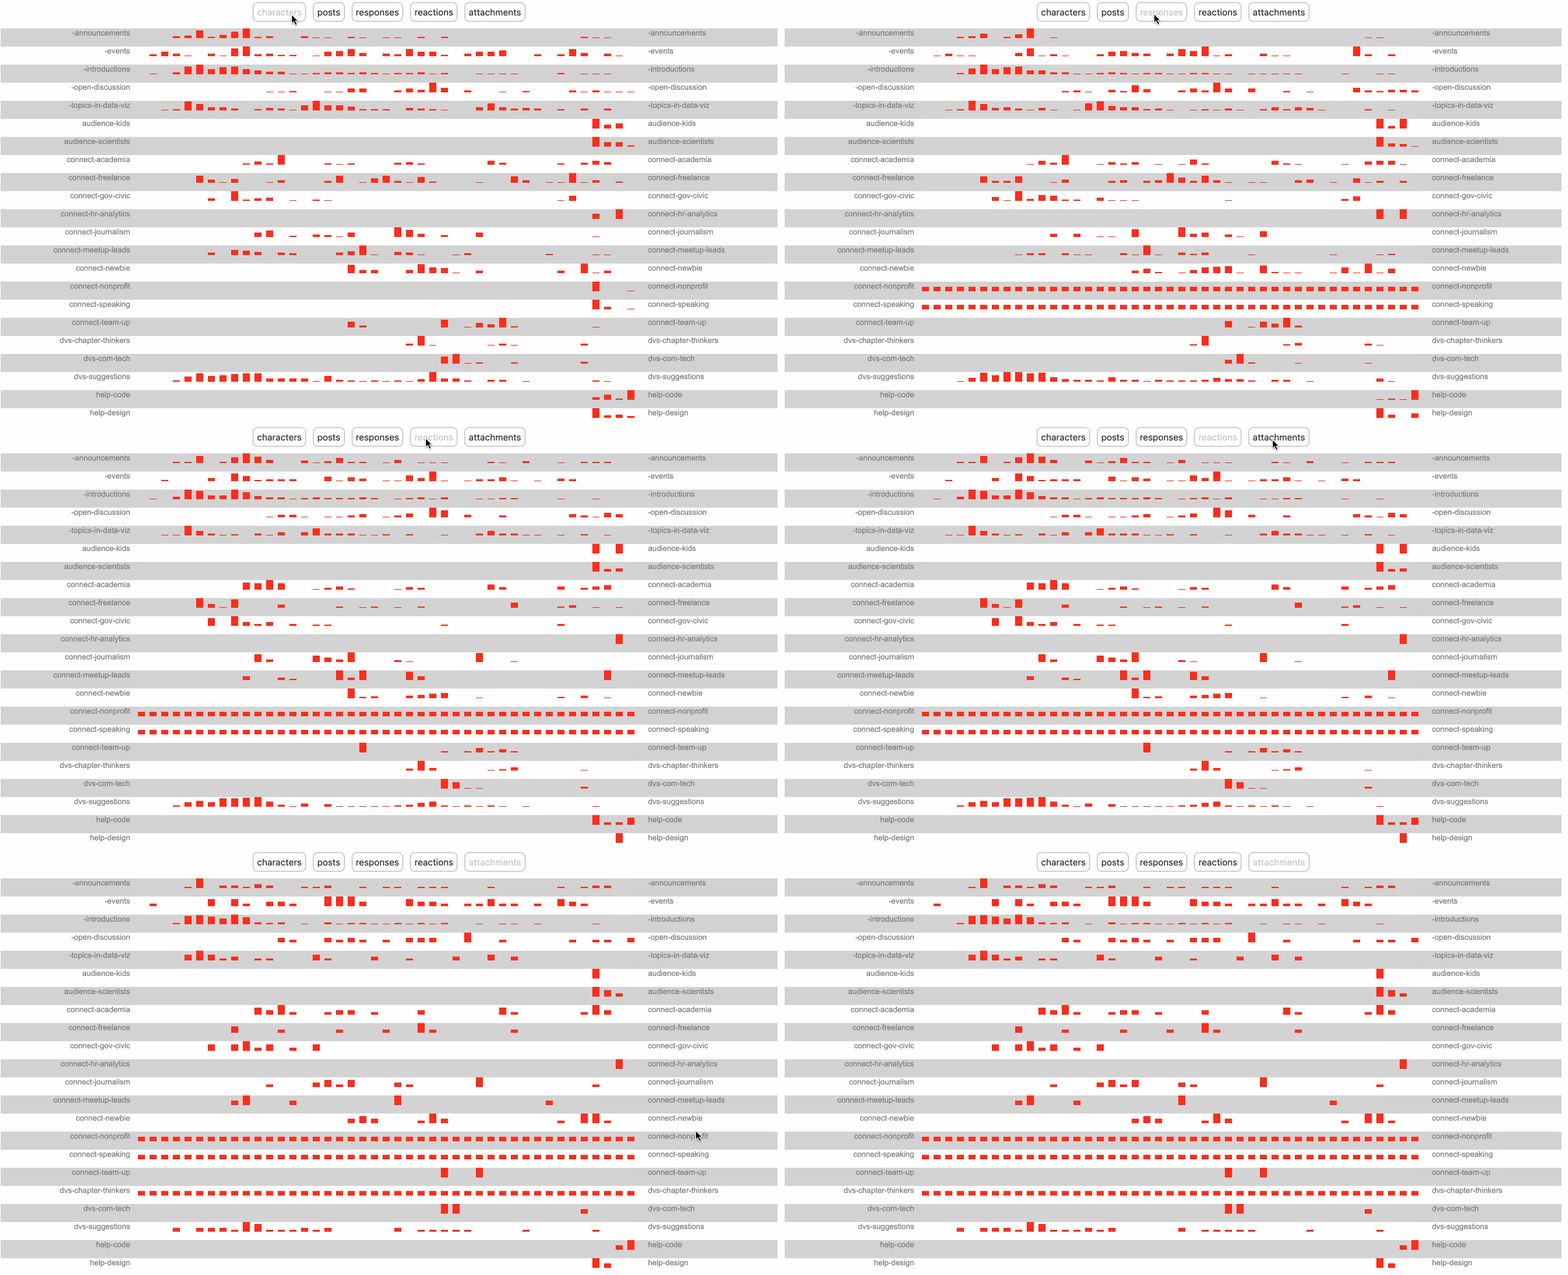
With this viz implementation I was trying to expose how the different metrics for the channels have been changing over time. We can see almost all the channels at once and we can dynamically change what metrics we load. I decided to use a regular bar chart to encode the time series data per each channel. I also decided to not show the dates so we can focus on the trends on each channels. I don't consider that piece of information that important for this dataset.


