


Your City’s Yearly Total Is the Wrong Unit
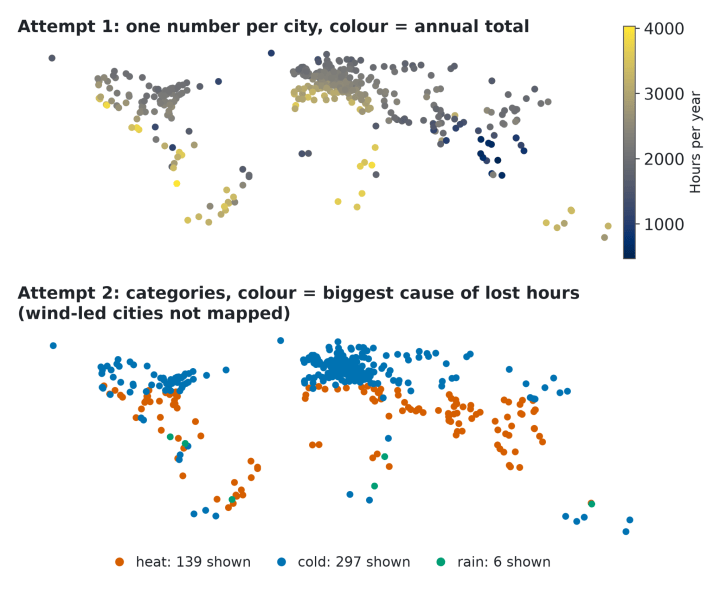
Two ways a single number hides how a climate dataset actually behaves, and what I did about each I built a map that ranked cities..
Latest Nightingale Articles and News
Two ways a single number hides how a climate dataset actually behaves, and what I did about each I built a map that ranked cities..
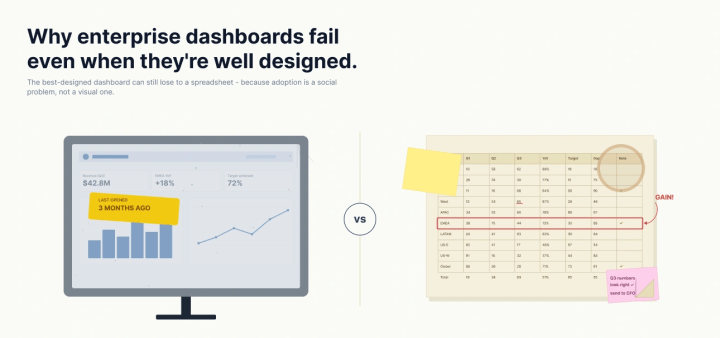
The best-designed dashboard can still lose to a spreadsheet, because adoption is a social problem, not a visual one. I have built dashboards that did..
Whether you are just starting out or shaping the future of the field, find the dedicated resources from the Data Visualization Society team. Choose the roadmap that aligns with your current expertise and your next career milestone.
Build your foundation with resources designed to help you learn, practice, connect, and grow.
Start to LearnA curated guide to tools and resources from the DVS team for practitioners.
Explore the Field GuidePrincipal Product Designer at Adobe
Finding a supportive community of experts and enthusiasts at DVS to learn, seek advice, and celebrate successes.

Lead BI Analyst at Capital One
Launching a BI analytics career through meaningful professional connections in the DVS Slack community.

Tableau Developer
Building confidence through the Mentorship Program.

Explore our exclusive publication featuring the latest trends, insights, and stories in data visualization.
View ArticlesEnhance your skills with expert-led video tutorials covering essential tools and advanced techniques.
Browse VideosAccess curated guides, best practices, and cutting-edge tools to elevate your data visualization projects.
View All ResourcesAccess job boards, connect with agencies, and explore data visualization roles.
Learn More