CREATED BY: @Gwen A
DESCRIPTION:
This visualization is interactive. Feel free to explore, interact, click, select on the map and different data points.
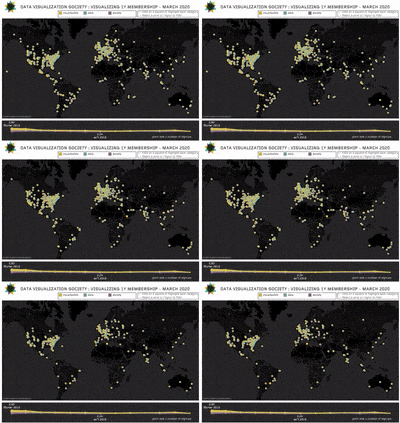
It aims to show the density of signups over the world and how people rank their skillset on the 3 categories.


