Created by: @wjsutton12 (instagram) @WJSutton12 (twitter)
Description:
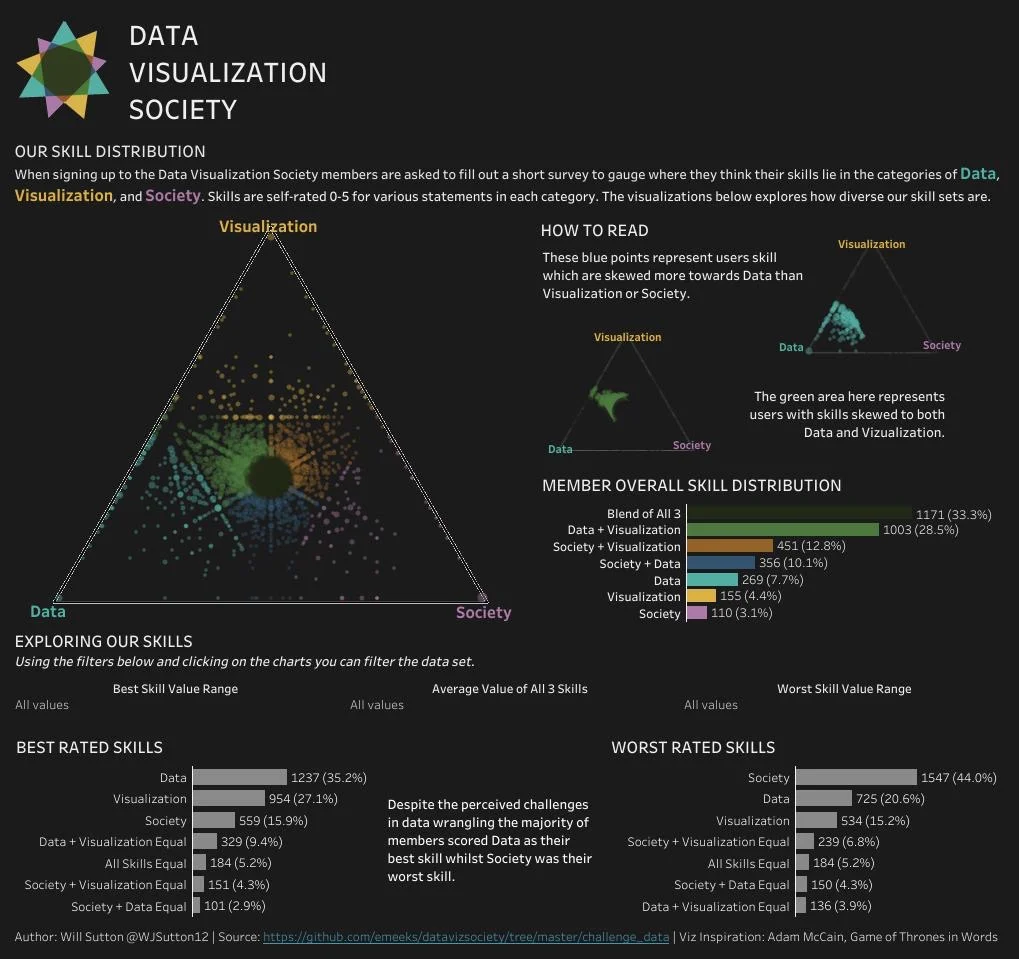
An exploratory data analysis piece on the range of skill of DVS members
Process for Creation:
I thought it would be interesting and useful for the community to understand the skill base of its users, what our strongest & weakest skills were so we could identify areas to help and improve the community’s skills. For the triangle plot I took inspiration from Adam McCain’s Tableau Public Game of Thrones visualisation and thought the same method could be applied to DVS skills for an overview, then I explored where the majority of members where skill wise. The lower section allows more exploratity analysis, e.g. if a user’s best skill is visualization what’s most likely to be their worst skill? Also how does the society look for members with lowest skill of 3 or more.


