CREATED BY: Greta C. Vega & Estefanía Casal
DESCRIPTION:
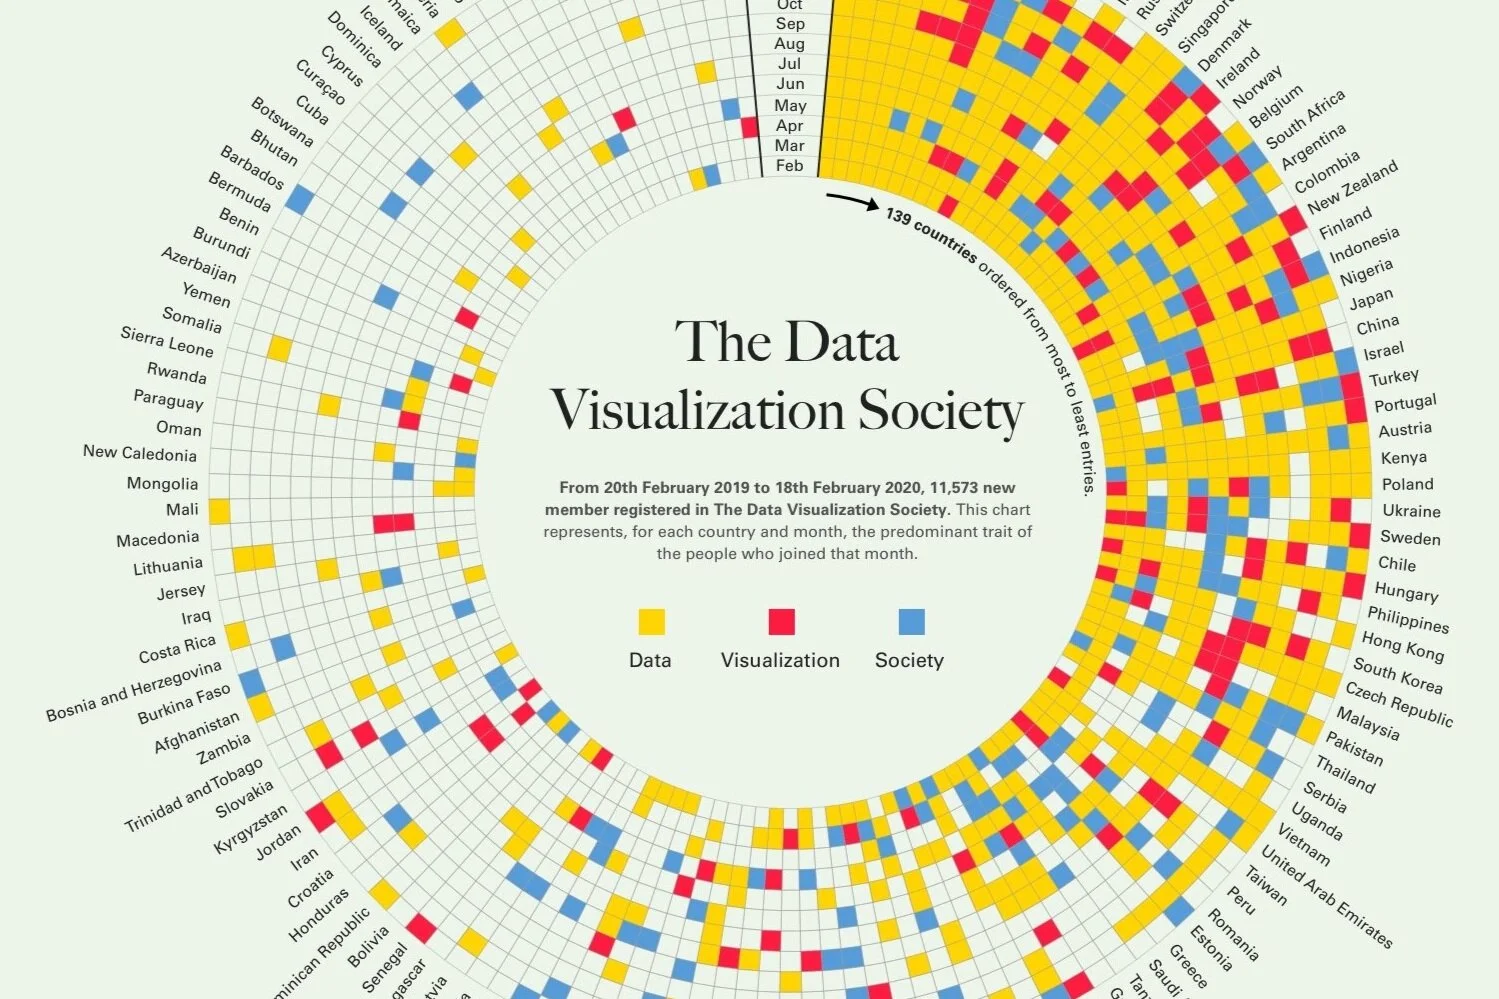
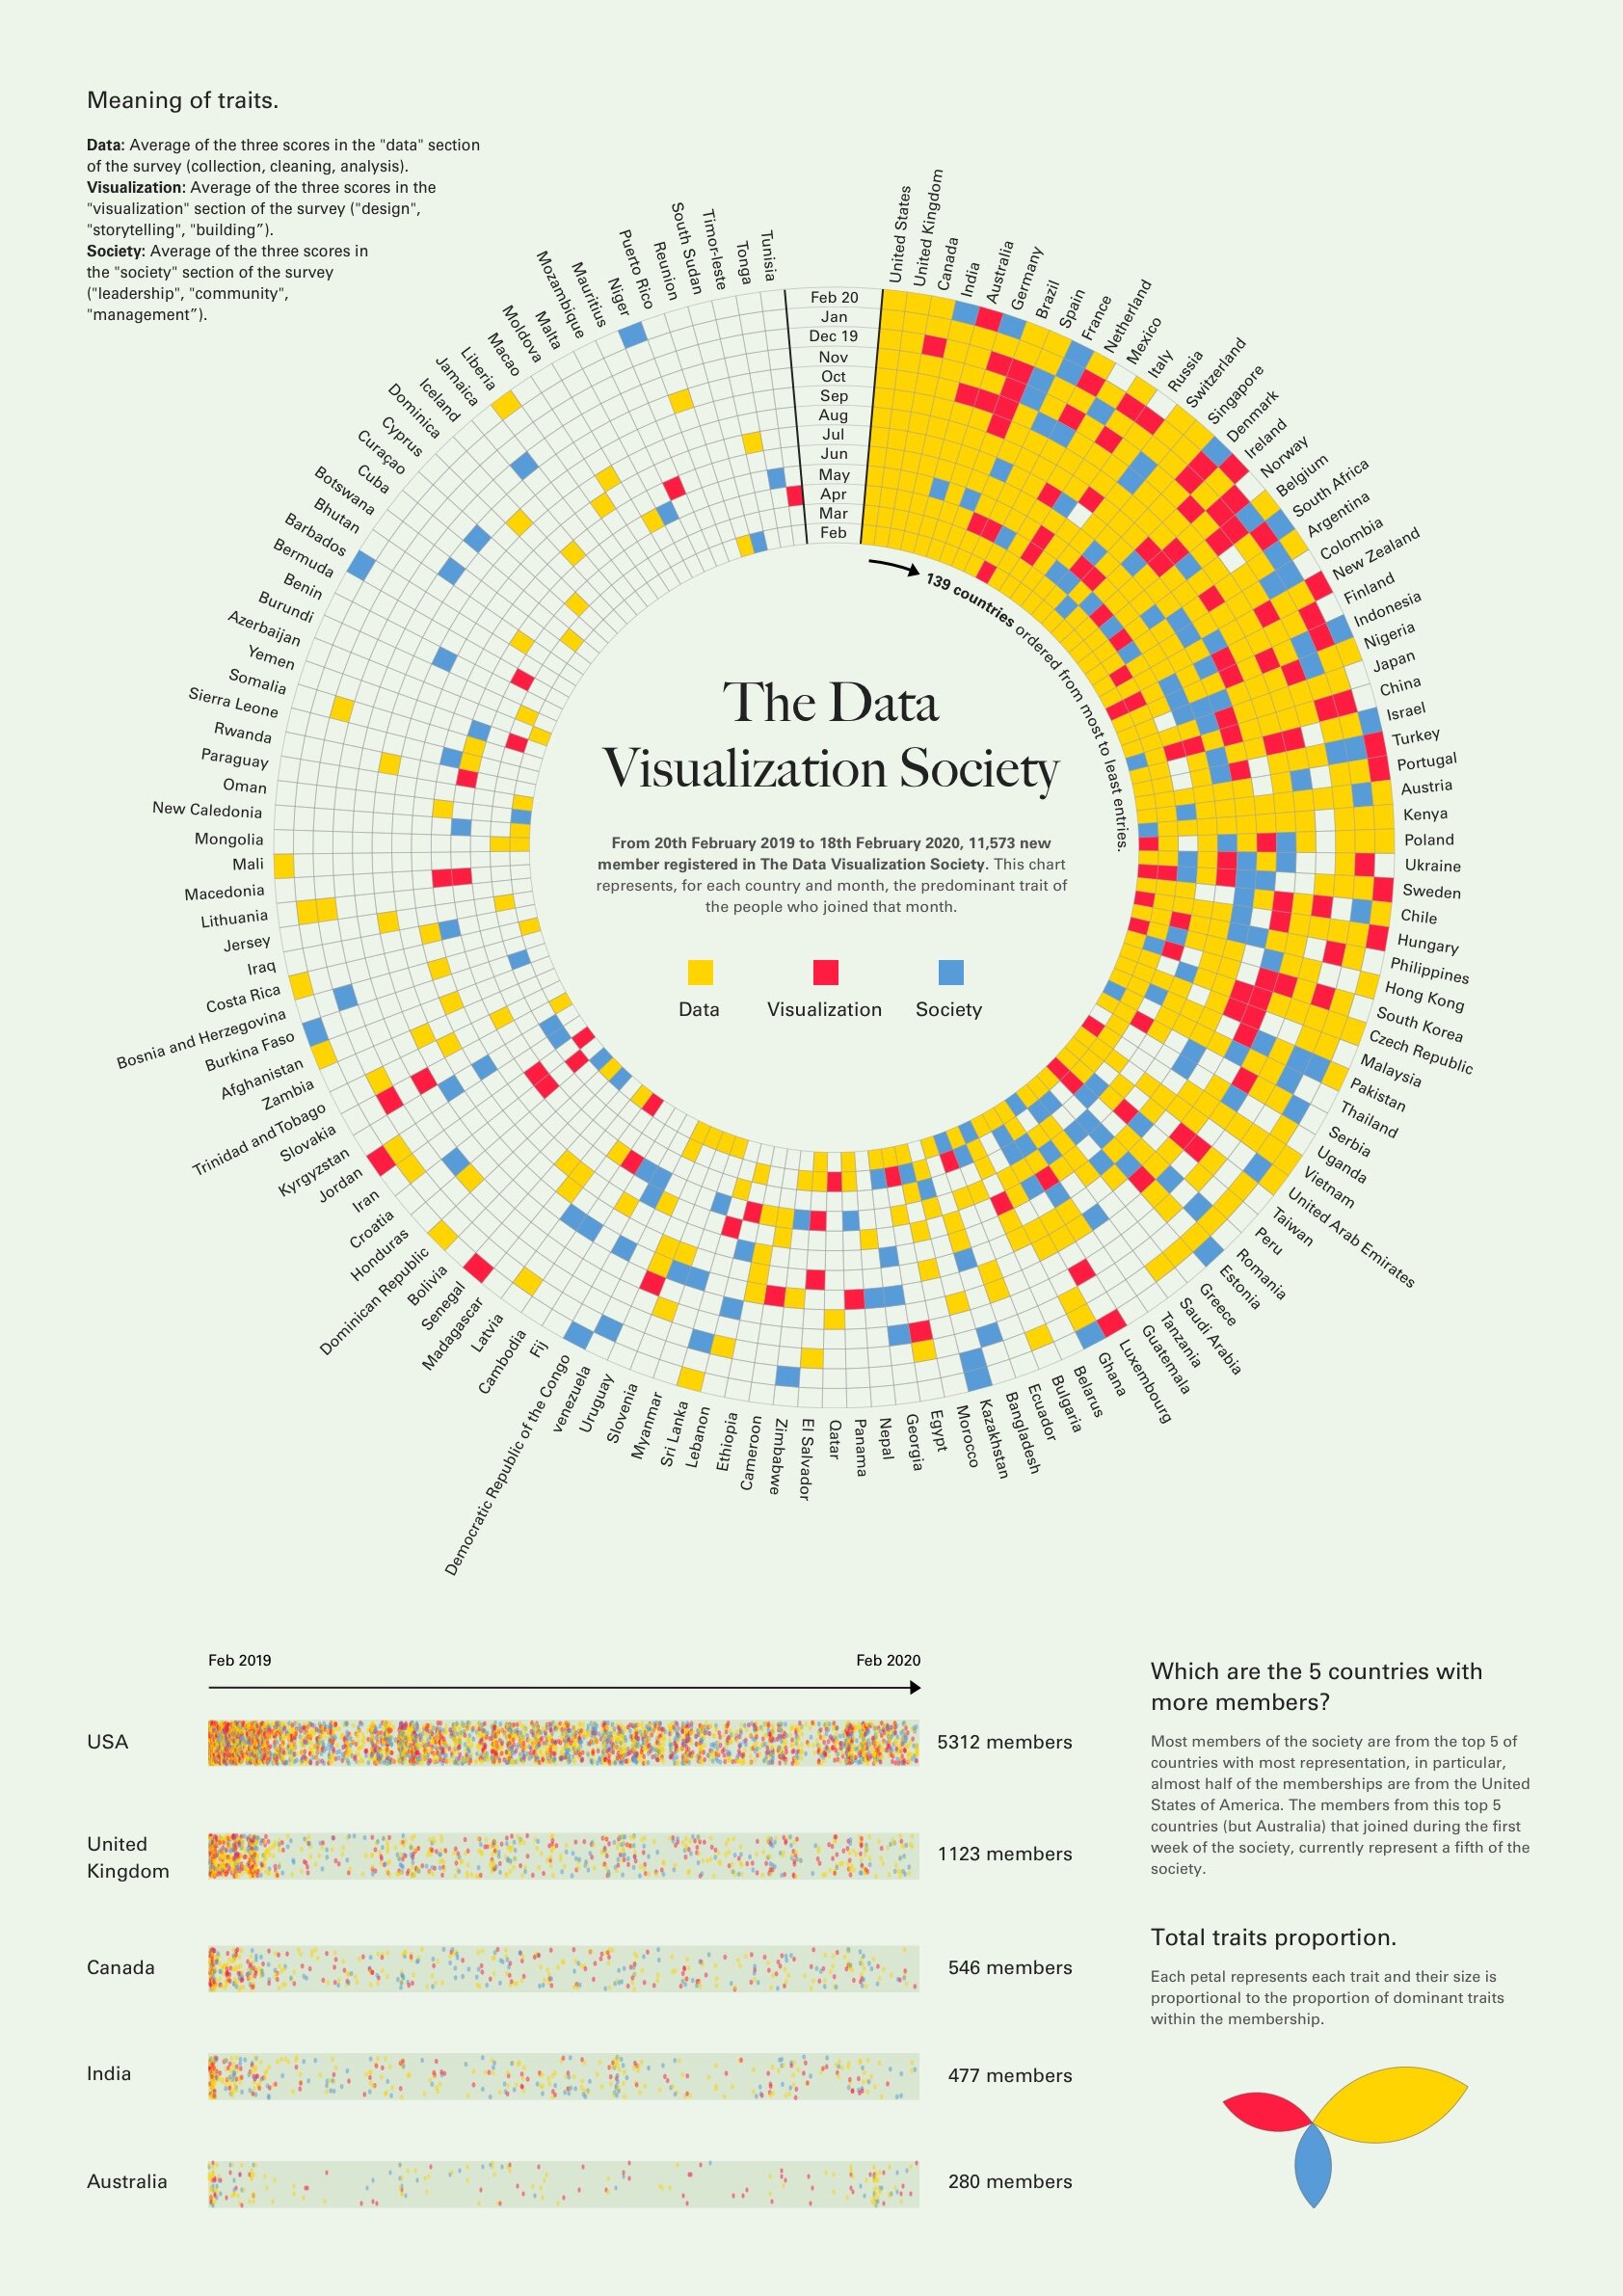
We have based our charts on the dominant trait of each member and grouped them by country and month at which they joined. We have combined R coding and manual design.
PROCESS:
After I did a quick first exploration of the data, I described it to Fanny who started to shoot loads of questions, the ones I retained were:
- From which country are the people and
- Which of the three traits is dominant in each person. It took me a few weeks to answer her questions, I used R and the GADM dataset to get the country of each person and then I decided I would do the rest of the challenge using the tidyverse as much as possible. Fanny came up with the idea of showing the monthly evolution of the Society while differenciating the country of origin and the dominant character. Also she suggested we created a more organic chart where the origin of the member wasn't taken into account, she suggested we drew petals and I almost had a heart attack. As Fanny saw I was struggling with the petals, she came up with more ideas based on getting a closer look for some countries. So at the end uniting Fanny's artistic skills and my data processing skill we have come up with this. I have published a notebook in my github with the code behind, hopefully soon I can clean it and document it better.


