CREATED BY: Dan McCarey, Maptian
DESCRIPTION:
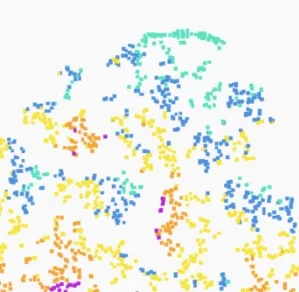
I created these t-SNE plots using the aggregate score for each category and the hour of sign up.
PROCESS FOR CREATION:
I used Graphafi to plot the DVS dataset with different dimension reduction techniques.


