CREATED BY: Alli Torban
DESCRIPTION:
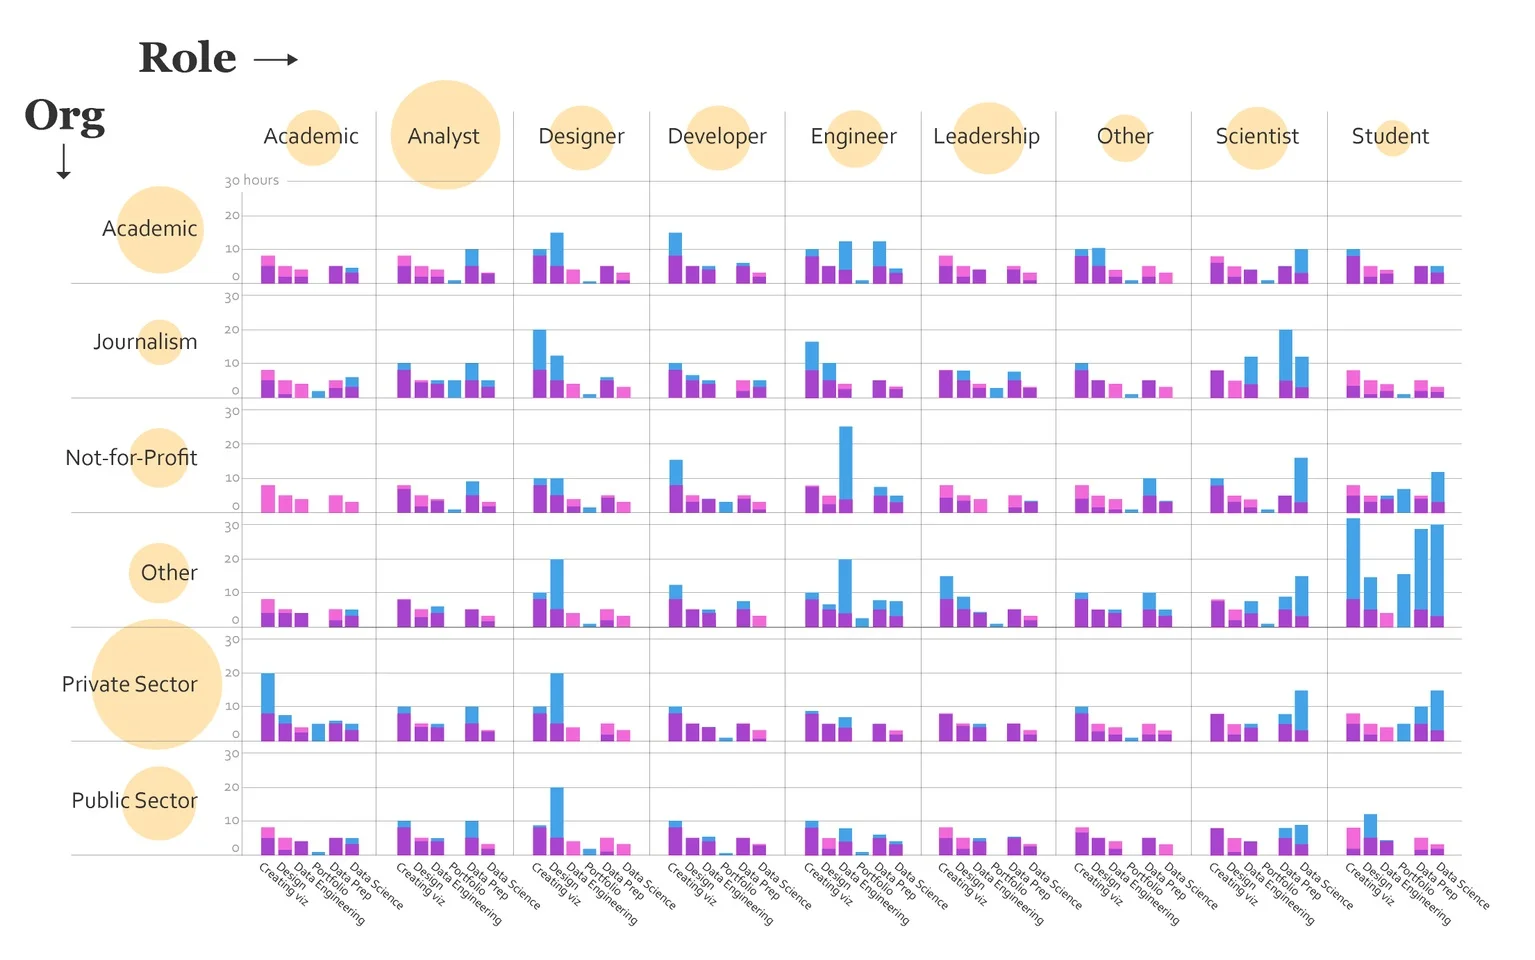
As a job-seeker in the budding field of data visualization, it can be difficult to know which role and organization would be the best fit for your needs. Maybe you're an engineer who wants to also dabble in design. Or maybe you're an academic who wants to spend a lot of time creating.
This year's Data Visualization Society Community Survey collected responses for how practitioners spend their time, and by visualizing the results, we can explore the differences in daily duties across various roles and organizations.
How do you want to spend your time? Perhaps a different role or organization could be worth exploring.


