

Industry Reports
Read the latest industry trends and reports about data visualization created by the Data Visualization Society.
2025 State of the Data Viz Industry Report
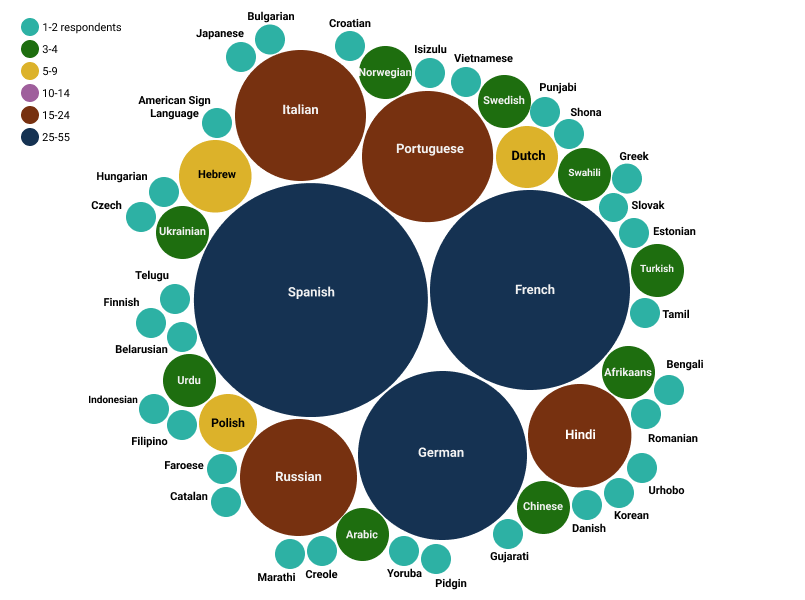
Figure 3. Non-English Languages Spoken by Data Visualizers (counts)
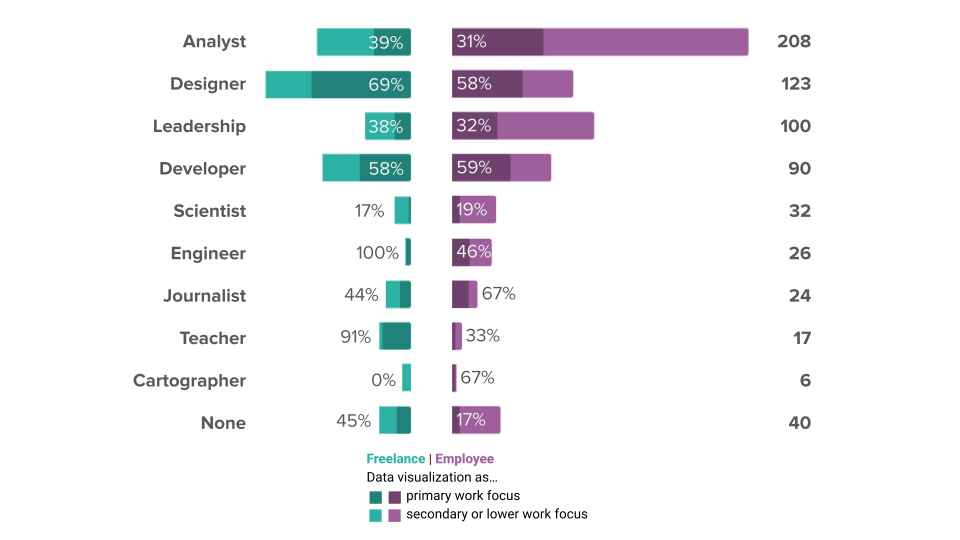
Figure 7. Primacy of Data Visualization by Role Type (percents)
Executive Summary
The 2025 SOTI survey was disseminated online between December 17, 2025 and January 30, Distribution mechanisms included an email announcement and series of reminders from the official DVS email address, an announcement in Nightingale (the DVS publication), a series of posts on the DVS Slack, and numerous social media posts (e.g., X, LinkedIn) from DVS and others
(e.g., Meetup Groups).
As in previous years, our challenges with doing data visualization include not having enough time as well as technical limitations of tools, though there are many challenges that impact visualizers’ work. The theme of limited time also arises when considering what others don’t understand about data visualization work. We also struggle to explain the effort required to create a quality data visualization and that visualizations are not only meant for decoration.
All Reports