

Quite an effective scrollytelling piece and highlights the main groupings in the data
Created by Maria Fedorova
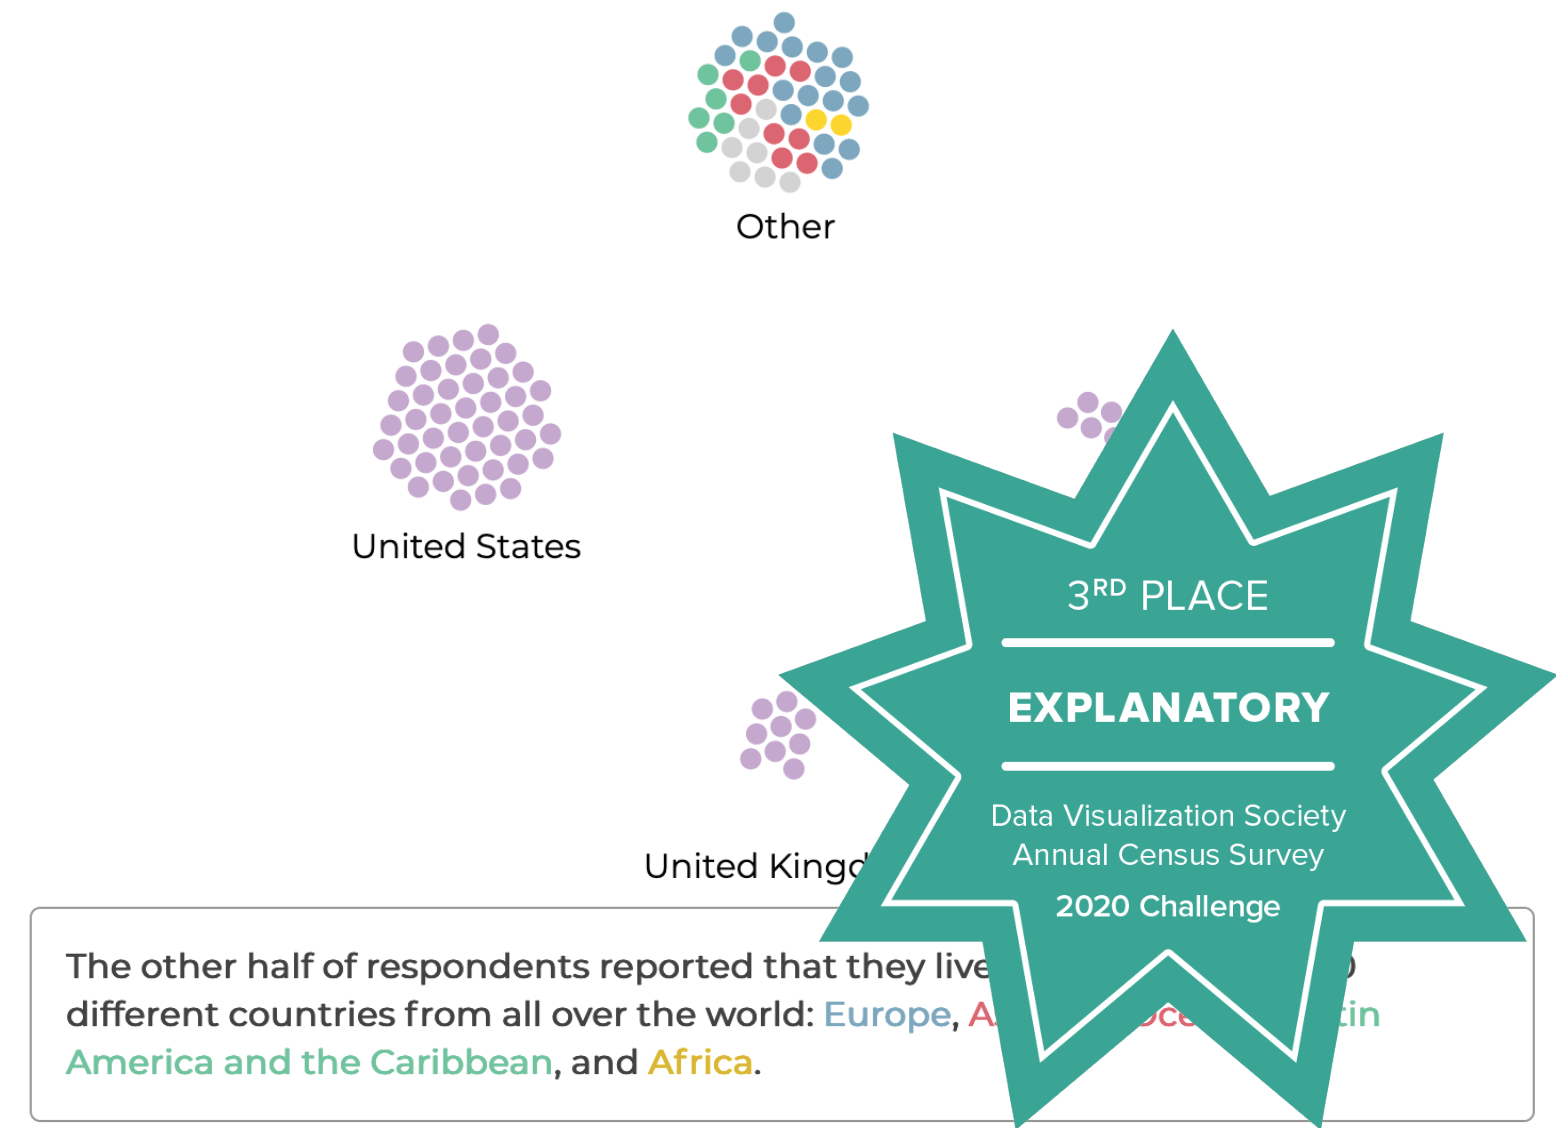
Interactive visualization of the demographic characteristics of the Data Visualization Community members. For now best viewed on Desktop using Chrome.
