This is a neat exploratory story that invites readers to learn more about the data using the scrollytelling mechanism. The design is interesting and allows the viewer to quickly see the demographics in the data visualization field.
Created by Loris Mat
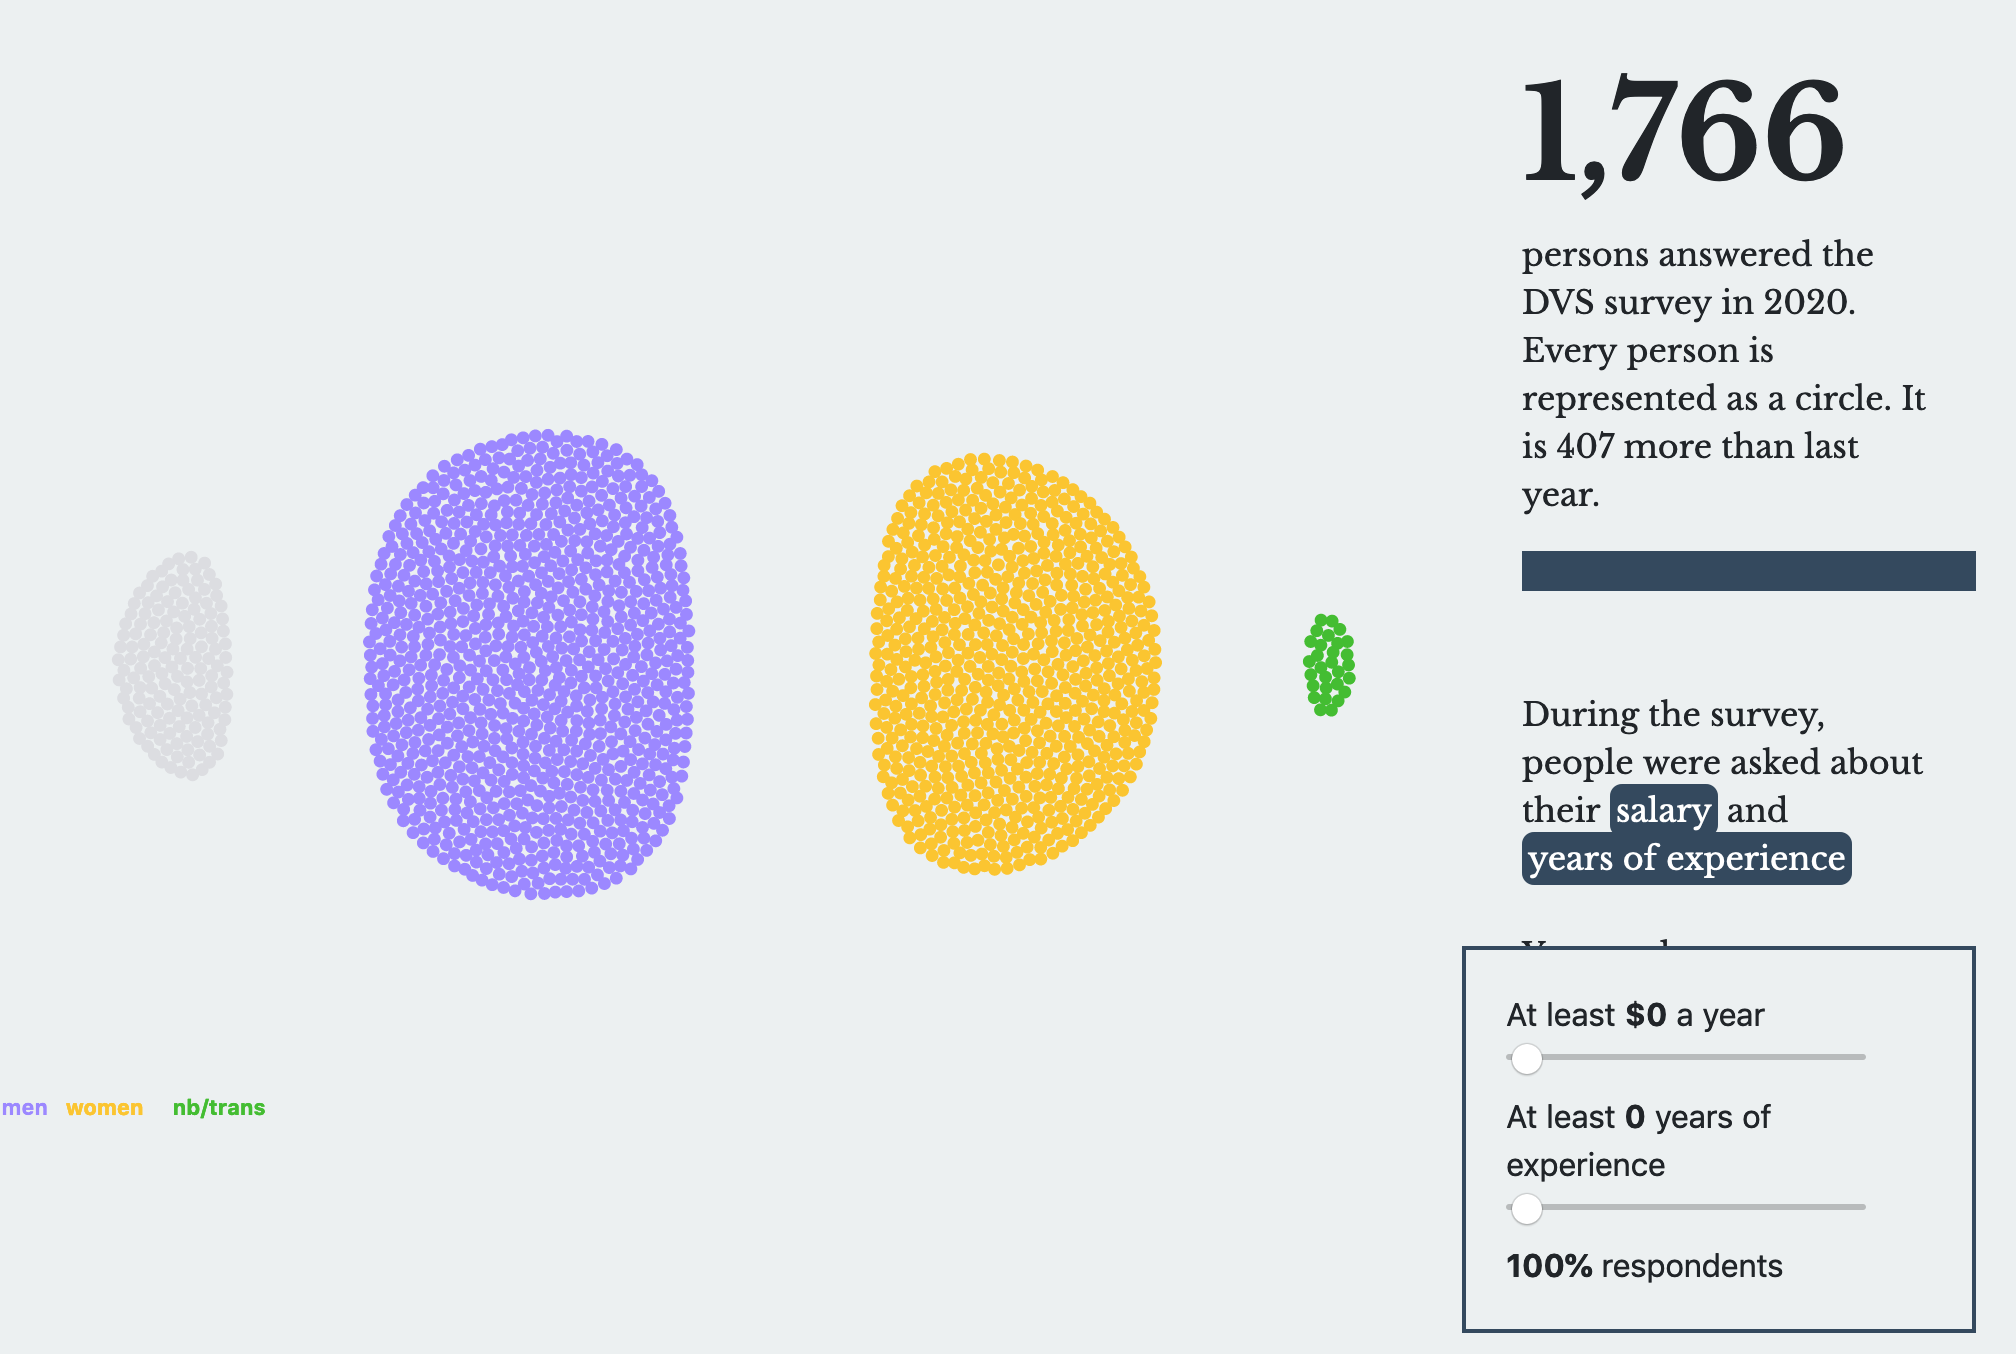
Exploring a few answers to create groups/subgroups and get an overview of data viz respondents in 2020