Catch up on Outlier 2024!

You can now catch up on Outlier 2024 with 34 recorded talks and 2 panel discussions. We know it’s a big list to process, so we suggest starting with keynote talks: 

You can also browse our beautiful gallery of 100+ photos taken during the conference. 

Happy viewing!

Future Fridays—Data for impact: Taking fast fashion to task

In partnership with infogr8, you will learn how to create data viz solutions that address societal challenges.

July registration for Future Fridays are open through July 3rd, 2024.

You’ll dive into the world of fast fashion with Aida Horaniet Ibañez, a postdoctoral researcher at the University of Luxembourg, and learn how to communicate data on controversial subjects. Join this exciting opportunity to connect with the community and practice your design skills! More details on how to join here.

20% off Data is Beautiful Workshop

Our partner Information is Beautiful is offering 20% off their online workshop to dues-paying DVS Members.

Date + Time: July 2nd, 10 am - 4 pm Central Time

Learn to create impactful infographics & data-visuals. These introductory-level seminars are a mix of lecture & hands-on exercises with plenty of discussion. Founder David McCandless, data-journalist, information designer and author, will present techniques and creative processes which lead ‘beyond the bar chart’. Attendees will break into virtual breakout rooms to do creative exercises, and also do solo work.

Visit our discounts page to claim this offer.

Outlier 2024 Registration Extended

It’s not too late for you to grab your Outlier 2024 tickets, our annual dataviz conference. We’ve extended the registration deadline to June 5th for in-person tickets and June 10th for virtual ones. 

With 3 keynotes, 23 talks and 2 panel discussions, there is something for everyone. Our three-day conference packs a wide range of topics, from business intelligence to data sonification to climate action. You won’t want to miss it! Register today: https://outlierconf.com/

NEW How-To Series: Data Viz for Social Good

How is data viz for social good defined? What are the skills needed to be successful in this space? Dr. Brown, a Public Health Communications Researcher and former DVS Programs Director, will unpack these questions and help you think critically about contributing to social good projects. Start learning.

This learning resource is available to dues-paying DVS Members. Not a member yet? Upgrade here.

The Mentorship Program returns! Apply now for the June - August cohort.

This is one of our most popular programs at DVS, offering mentees early in their visualization career an opportunity to work with a mentor who has 5+ years of professional experience in the field. Many mentors and mentees have shared how beneficial this program has been for their growth, some continued to stay in touch even after their cohort ended!

  • Mentee applications are open now through May 24. To be eligible as a mentee, you must be a dues-paying DVS member.

  • Mentor applications are open year-round, anyone can apply to be one. Mentors support data visualization learning and help their mentee navigate their career options.

Learn more about how our Mentorship Program works. If you're not a dues-paying member and are interested in becoming one, check out our membership page.

Nudging users through emotive design: Future Fridays in May 2024

May registration for #FutureFridays are open through April 28, 2024. In partnership with infogr8, you will learn how to create data viz solutions that address societal challenges. In May, you’ll dive into the use of emotion in data communications and how you could incorporate it into your data visualisation projects.

If you signed up for Future Fridays before, you need to register again.

Join this exciting opportunity to connect with the community and practice your design skills! More details on how to join here.

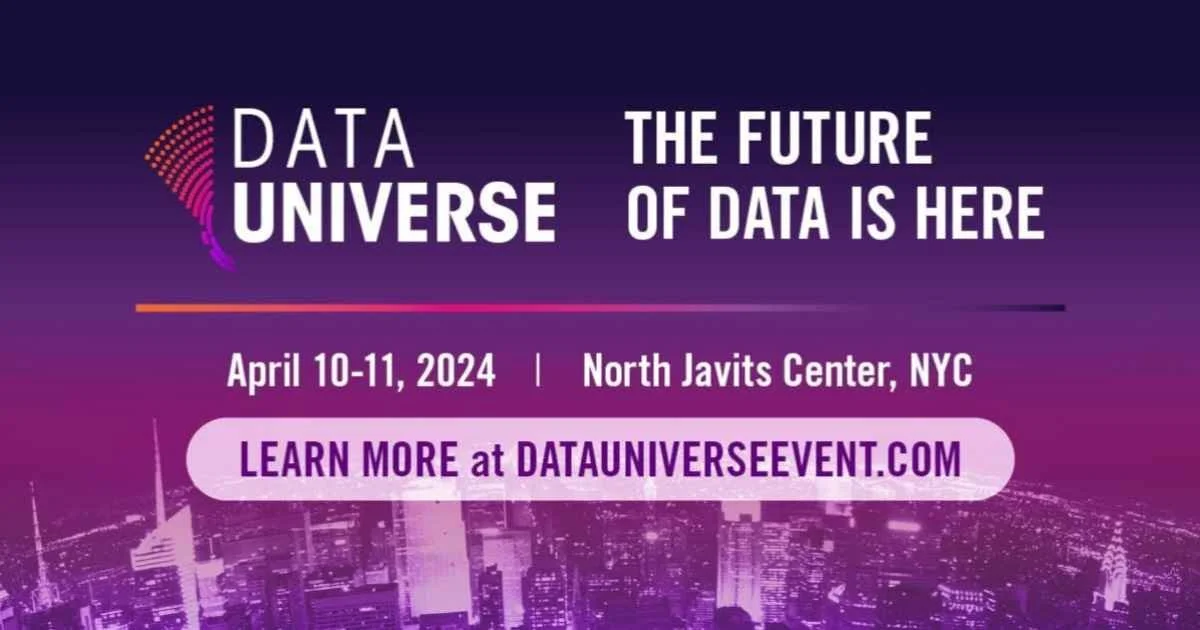
Attend DataUniverse 2024 in New York City

We're pleased to extend a special invitation to you for DataUniverse in New York City, a leading event in the field of Data and Analytics.

Thanks to the event organizers, we’ve secured a limited number of complimentary tickets (worth over $900 each) for DVS Members.

This opportunity is offered to dues-paying member; it’s a great chance for networking and learning. Not a dues-paying member yet? Upgrade here.

Event Details:
Location: North Javits Center, New York City, NY
Date: April 10-11, 2024Visit our partner discounts page to retrieve the discount code.

Register for the April edition of Future Fridays

April registration for #FutureFridays are open through March 31, 2024. In partnership with infogr8, you will learn how to create data viz solutions that address societal challenges. 

Craig Taylor (Mapzilla) is the featured guest for April’s theme, Mapping Digital Literacy in Europe. Craig will provide guidance and feedback as you develop your visualization.

Note: If you signed up for Future Fridays in March, you need to register again for April.

Join this exciting opportunity to connect with the community and practice your design skills! More details on how to join here.

Join Future Fridays to design for social impact

We’ve partnered with infogr8, a team of visual data storytellers, for Future Fridays to invite the DVS community to dive into a societal challenge by wrangling with data and developing creative solutions. You will go behind the scenes, collaborate with data experts, and learn by participating in new monthly social impact challenges.

The first Future Fridays event is on March 1st. Sign up by Feb 28 to join this exciting opportunity to connect with the community and practice your design skills! More details on how to join here.

Join the 2023 DVS Survey Challenge

The DVS State of the Data Viz Industry Survey Challenge is here!

This Challenge uses the 2023 State of the Industry Survey data and provides data visualization practitioners an opportunity to use their visualization skills while learning and sharing observations and insights about data visualizers around the globe.

New this year, we have segmented the data into five separate datasets that roughly align with sections of the State of the Industry Survey Report and make it easier for visualizers to focus on a topic. Check out this page website for additional details on the dataset and the process for entry and judging. Each entry also receives private, anonymous feedback from at least two judges in the dataviz field.

The Challenge is open for 6 weeks and will close on March 31 at 11:59P PT.

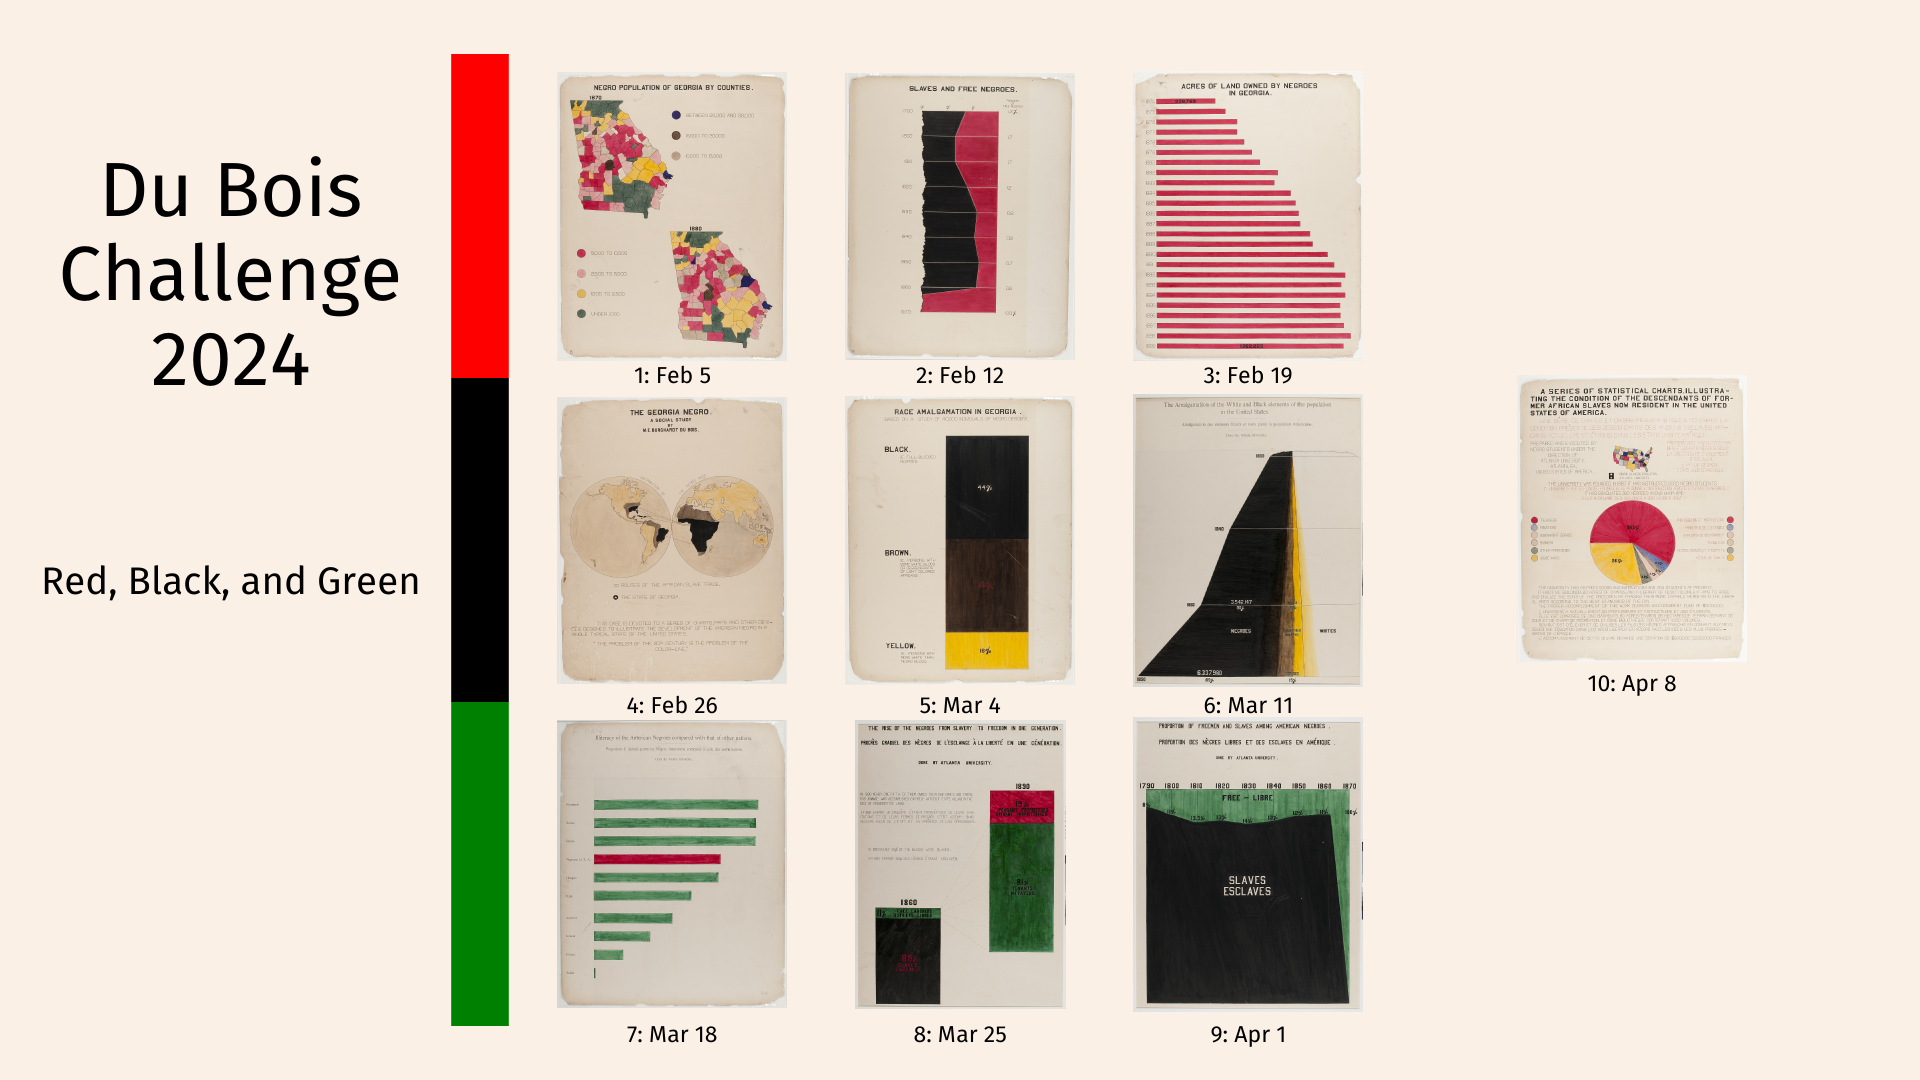
Advance your data viz skills with the weekly 2024 Du Bois Visualization Challenge

Advance your data viz skills by practicing a new tool or experimenting with a familiar one through the 2024 Du Bois Visualization Challenge! Starting on February 5th, the challenge leaders will post a visualization every Monday for 10 weeks on social media and DVS Slack for participants to recreate.

The goal of the challenge is to celebrate the data viz legacy of W.E.B Du Bois—a Black American civil rights activist, sociologist and writer—by recreating the visualizations from the 1900 Paris Exposition using modern tools. 
Visit Github for full details of each week’s challenge, including the 1900 original plates and the corresponding dataset.

2023 State of the Data Viz Industry Report

We’ve just published our 2023 State of the Data Viz Industry Report, which summarizes 869 responses about the state of data viz, the people who make it, the challenges they face, and where the field is headed. 

This report will provide relevant insights whether you plan to transition into a data viz career or want to stay on top with the latest tech used to create data viz.

The report is available to all DVS Members and is free to access until Feb 5th.