You can now find us on Bluesky! We'll start sharing updates on the platform—follow us on Bluesky to receive the latest DVS updates!
Outlier 2024 speaker applications now open!
Speaker applications for Outlier 2024 are now open! Anyone is welcome to apply with the aim to bring together speakers from a diverse range of backgrounds, data viz projects, and domains of expertise. Submit your application by Friday, February 24, 2024 at 11:59 pm PST. We look forward to receiving your applications!
Advance your data viz skills with the weekly 2024 Du Bois Visualization Challenge
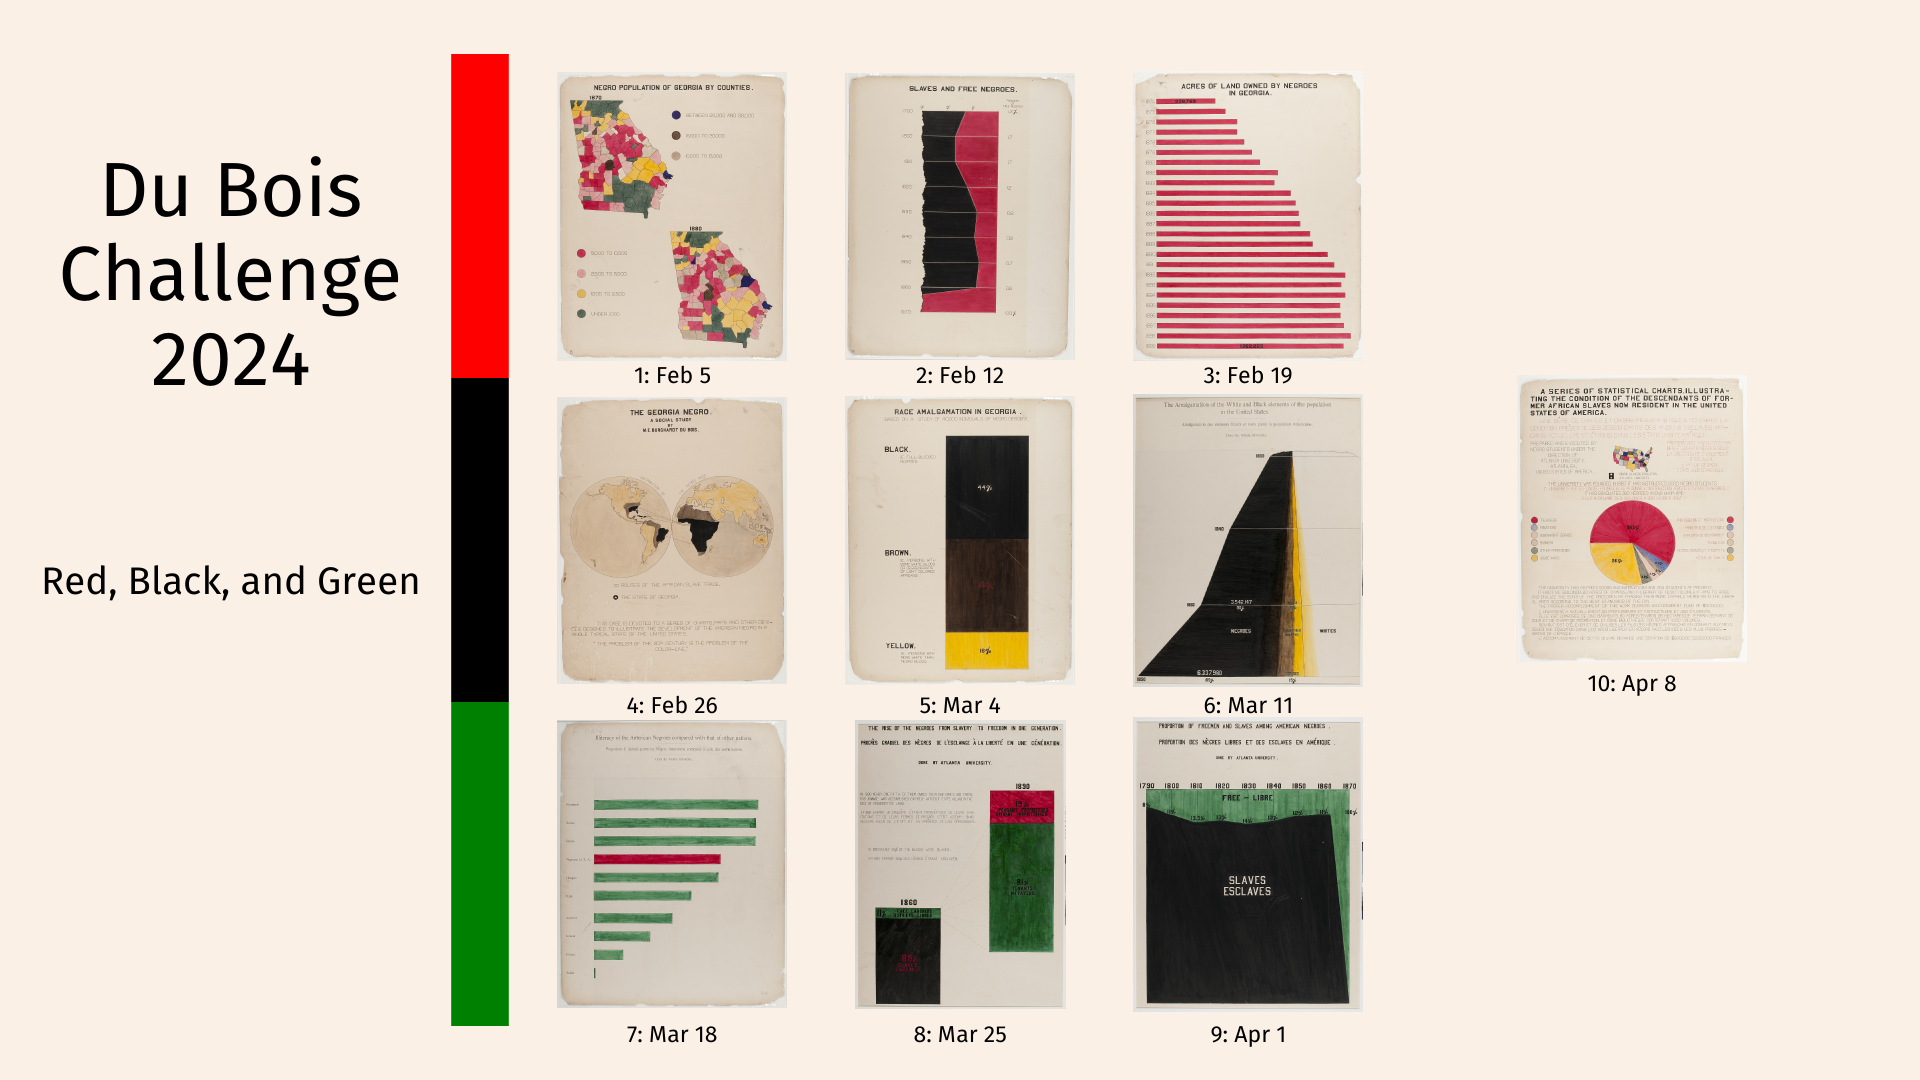
Advance your data viz skills by practicing a new tool or experimenting with a familiar one through the 2024 Du Bois Visualization Challenge! Starting on February 5th, the challenge leaders will post a visualization every Monday for 10 weeks on social media and DVS Slack for participants to recreate.
The goal of the challenge is to celebrate the data viz legacy of W.E.B Du Bois—a Black American civil rights activist, sociologist and writer—by recreating the visualizations from the 1900 Paris Exposition using modern tools.
Visit Github for full details of each week’s challenge, including the 1900 original plates and the corresponding dataset.
2023 State of the Data Viz Industry Report
We’ve just published our 2023 State of the Data Viz Industry Report, which summarizes 869 responses about the state of data viz, the people who make it, the challenges they face, and where the field is headed.
This report will provide relevant insights whether you plan to transition into a data viz career or want to stay on top with the latest tech used to create data viz.
The report is available to all DVS Members and is free to access until Feb 5th.
New partnership: Get 15% off VIZBI 2024 Registration
We've partnered with VIZBI 2024 to offer our dues-paying members a 15% discount on registration for the upcoming 14th international meeting on Visualizing Biological Data (VIZBI 2024). The meeting takes place March 12–15, on-site at USC in Los Angeles, and also online. To get early-bird rates, register before February 5.VIZBI attracts prominent scientists, medical illustrators, designers, and science communicators (see Nature News article). The meeting comprises two events:
The VIZBI Masterclass (March 12), a 1-day training event in data visualization providing an opportunity to learn cutting-edge techniques from leading practitioners, including Martin Krzywinski and David Goodsell.
The VIZBI conference (March 13–15), featuring keynotes from Jessica Hullman, Anders Ynnerman and Alex McDowell, as well as plenary talks from 18 leading researchers developing and applying data visualization across the scales of life, from DNA, RNA, and Proteins, through to Cells, Tissues, and Ecosystems.
Visit our partners page to claim the offer. We hope you can take advantage of this offer and join them on-site or online in March.
Annual General Meeting: DVS 2023 Celebration + Recap
Data Visualization Society. Annual General Meeting. January 25, 2024.
We invite you to join us live for our Annual General Meeting (or ‘AGM’ for short) on January 25th at 9:30 am Eastern Time, where we will share:
DVS financial updates
Celebration of 2023 initiatives
Key priorities for 2024
All members are encouraged to join as we will also introduce our slate of incoming Directors for the 2024-25 term. The AGM will be livestreamed on the DVS YouTube channel so you can ask us questions and learn how you can get more involved. The recording will be available to watch asynchronously.
📆 Register to attend so you can add to your calendar and receive reminders to join the livestream.
🚀 The Mentorship Program returns! Apply now for the February - April cohort.
This is one of our most popular programs at DVS, offering mentees early in their visualization career an opportunity to work with a mentor who has 5+ years of professional experience in the field. Many mentors and mentees have shared how beneficial this program has been for their growth, some continued to stay in touch even after their cohort ended!
Mentee applications are open now through January 8. To be eligible as a mentee, you must be a dues-paying DVS member (either a Member or Patron). Check your membership status here.
Mentor applications are open year-round, anyone can apply to be one. Mentors support data visualization learning and help their mentee navigate their career options.
Learn more about how our Mentorship Program works. If you're not a dues-paying member and are interested in becoming one, check out our membership page.
How is award-winning data viz created?
You can now watch the 2023 Day of Inspiration talks on our YouTube channel. The day featured talks from the creators of shortlisted works—some of whom have won awards this year!
To help you start your watching journey, here are three talks from this year’s winners:
Visualizing Global Progress by Divyanshi Wadhwa (The Atlas of Sustainable Development Goals 2023 won Most Beautiful and Gold in Humanitarian)
Ripple Effect by Dorsey Kauffman (Ripple Effect won Gold in Arts, Entertainment, and Culture)
Every Market Needs a Map by Nikita Rokotyan (Market Map won Silver in Business Analytics)
Browse the 2023 IIB Awards Photo Gallery
The 2023 Information is Beautiful Awards ceremony brought the data viz community together on November 4th to celebrate the winners and the collective efforts of all data viz creators to advance the field. Browse the photo gallery and relive the moments. Happy browsing!
Get a free copy of Nightingale Magazine when you upgrade your DVS Membership
From November 24th-27th, you will receive a print copy of Nightingale Magazine Issue 3 for FREE (valued at US$40) when you sign up to be a General Member (US$99/year). Note that shipping and handling fees of the magazine are not included as they are a third-party cost to us.
If you’re currently a Basic member and you’ve been thinking about upgrading your membership, now is the best time!
This offer is only valid from November 24-27, claim your offer before it expires!
Become a DVS Member and redeem your offer!
DVS Board roles are open for 2024-2025 term
Each year, half of the seats on our 12-person board open for applications — and those applications open this week for two year terms that span from 2024-2025.
This year, we’re opening applications for the following roles:
Apply by December 15, 2023 to be considered for any of the roles above.
DVS Philanthropy just launched
We just launched DVS Philanthropy, a new interest group for anyone who works in philanthropic institutions and wants to leverage data viz for social good. Join the #topic-philanthropy Slack channel and connect with others in this group!
Outlier 2024 returns in Chicago
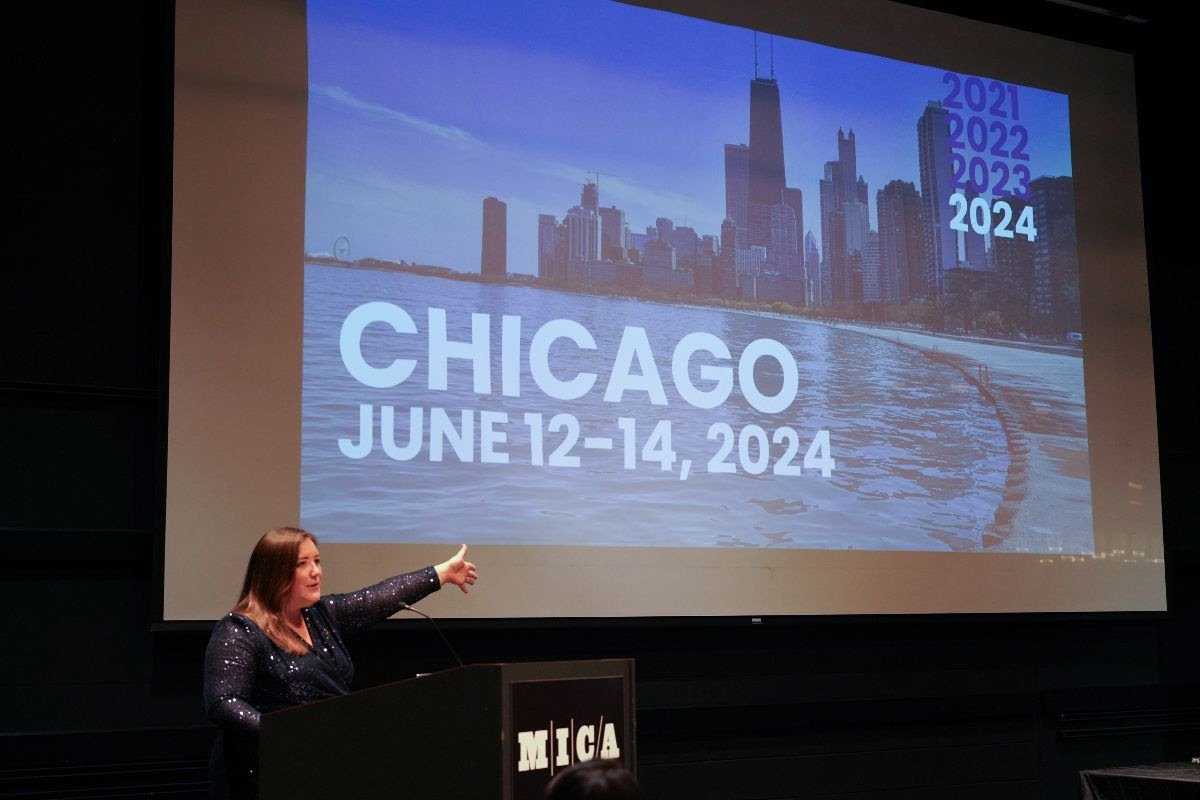
Amanda Makulec, Executive Director at DVS, announces Outlier 2024 will be in Chicago.
If you stuck through to the end of the 2023 Information is Beautiful Awards Ceremony on November 4th, we announced that Outlier 2024 will be in Chicago from June 12-14.
Outlier is an annual conference hosted by DVS and brings together all corners of the data visualization community. Attendees stretch their creative thinking and learn from practitioners who they may not otherwise connect with.
Early-bird registration and speaker application dates will be released soon. Check the Outlier page for updates.
Winners announced: 2023 Information is Beautiful Awards
This past weekend, we welcomed over 150 attendees for two days filled with data visualization inspiration and celebrations.
The Day of Inspiration mini conference on Friday covered topics ranging from what a career in data viz looks like to communicating water quality data through sonic vibrations to questioning our data culture. Rest assured that if you missed some of the talks or want to revisit any of them, all talks have been recorded and will be uploaded to the DVS YouTube channel in the coming months.
The Awards Ceremony on Saturday revealed 27 category award winners out of 86 finalists and 13 winners across seven Special Awards. Winners traveled and tuned in from different parts of the world to receive their award and join the celebrations. This year, we received a staggering number of 900 submissions from over 50 countries and 485 unique creators; a true testament to the diversity of perspectives and skills from the data visualization community.
We hope you had the chance to attend either by joining in Baltimore, online, or via a local watch party. In case you missed it, you can browse the 2023 winning entries in the showcase.


