


2019 DVS SURVEY – SALARY EXPLORER
CREATED BY: Thomas Gonzalez – BrightPoint Consulting
DESCRIPTION:
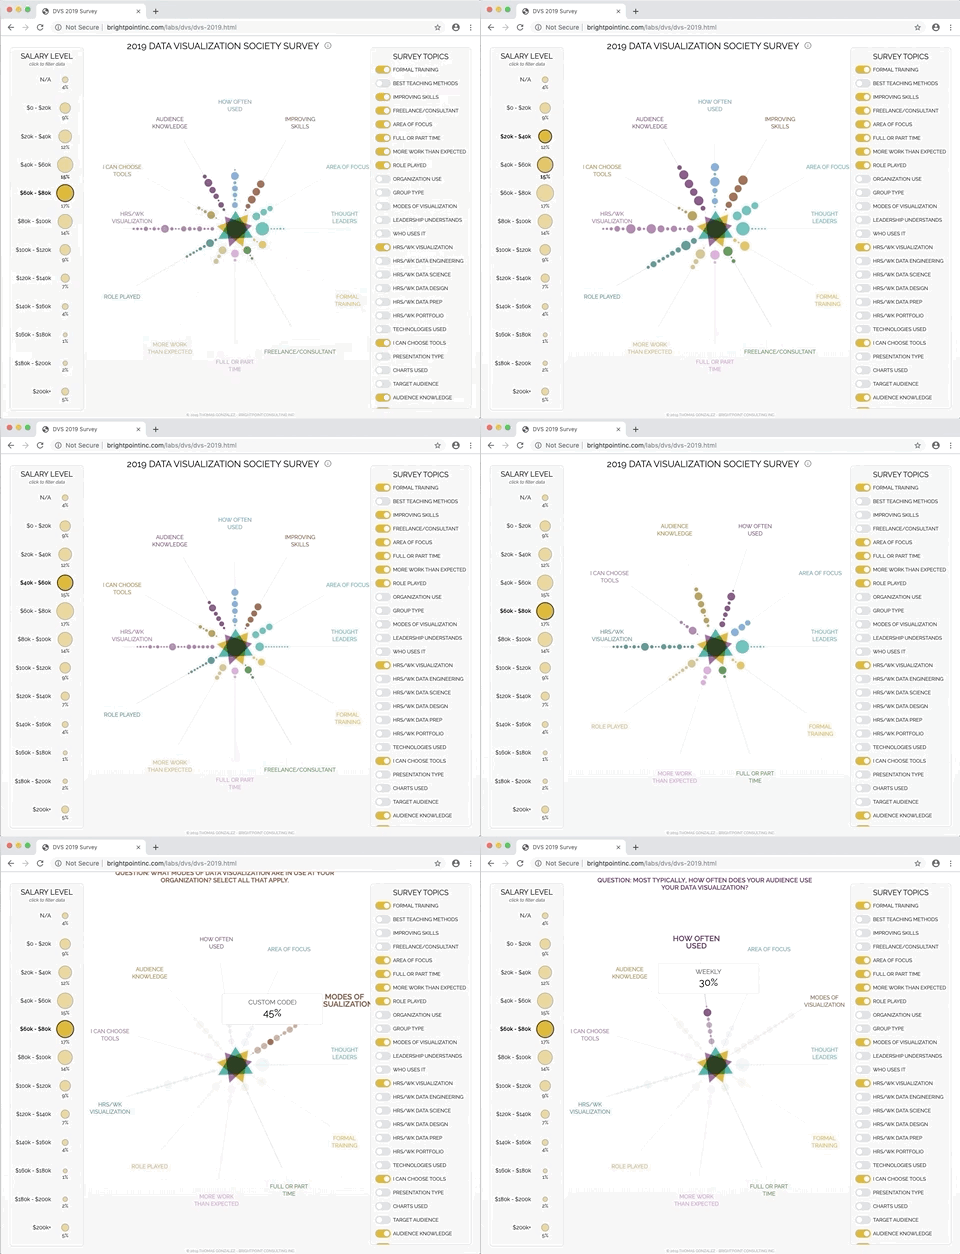
This interactive visualization allows users to explore the 1360 data visualization practitioners responses to the 50 questions asked in the 2019 DVS survey according to the respondent’s salary level.
PROCESS:
I started with a rough idea in my head for a visual concept to do doing multi-dimensional analysis of the survey data. I then used Sketch to mockup that idea and validate it at a high level. Once I was satisfied with the concept, I used D3.js and Vizuly.io to iterate from grayscale plots and animation to the final stylized interactive. Along the way, I needed to do a little bit of data processing to break down the multi-part answers and add custom labels for certain numeric answers (hours and rating scales.) I also spent a fair amount of time iterating through different animations to select ones that helped communicate state/data changes based on user input.